Visualizing the Global
Visualizing the Global | Computer Modeling, Ecology, Politics
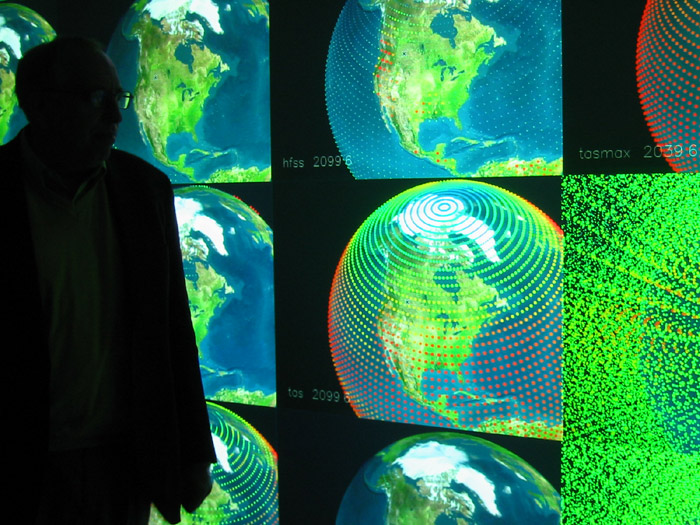
I Organized this cross disciplinary seminar at UIUC. I also developed a couple of demos including a 20-node tiled visualization of various layers output from the Parallel Climate Model AND an interactive visualization of global energy consumption from 1965-2002 for 73 countries driven by the data provided by the BP Statistical Review of World Energy. The Parallel Climate Model visualization involved a distributed python backend which consumed, processed and loaded model data to a projected display cluster. To accomplish the data-visualization and navigation on 20 parallel display nodes, I utilized Partiview, an open-source, C++ based, interactive data visualization tool written by Stuart Levy.
Tags: c++, climate change, parallel computing, python, visualization